Investment Philosophy
Losses are More Important than Gains
Investing today is more complex than ever amid uncertain earnings growth and periods of high market volatility. Equity market returns have, in many cases, leaped ahead of economic fundamentals causing an asset bubble, making future returns dependent on earnings growth. Adding to investors’ difficulties are drawdowns occurring during periods of stress, which can be particularly painful and persistent. Many investors diversify their portfolios across stocks and bonds to navigate these challenges.
We believe that managing risks in an investment strategy is the priority. The downside risk is more harmful to a portfolio than the upside return potential. A 10% or even 20% loss in a portfolio can easily be recovered, but a 50% loss requires a 100% return to break even. These large losses to a portfolio are attributed to periods in the economy called recessions, making recession avoidance the top priority of our investment philosophy.
Where do most of these losses occur? During a recession.
Figure 1: The Percent Return Required to Breakeven After a Loss
Macroeconomic Factors that Drive the Financial Market
The absolute and relative performance of broad asset classes is systematically related to macroeconomic trends, both cyclical and secular. These trends are inflation, interest rates, actual gross domestic product (GDP), profits, and income growth. The business cycle includes a monetary policy cycle, a profit cycle, credit cycles, inventory cycles, and cycles in housing and durable goods demand. Each business cycle has a pattern that rhymes while not precisely repeating. In other words, “every cycle is the same except for what’s different.” Plenty of studies suggest these macroeconomic factors explain the variance in asset prices. Take, for example, Black Rock; they identified six macroeconomic factors that can explain 90% of the market variance.

Growth

Inflation Expectations

Credit Risk

Interest Rates

Emerging Risk

Liquidity Risk
Smart Beta
(How Most Factor Portfolios are Built)
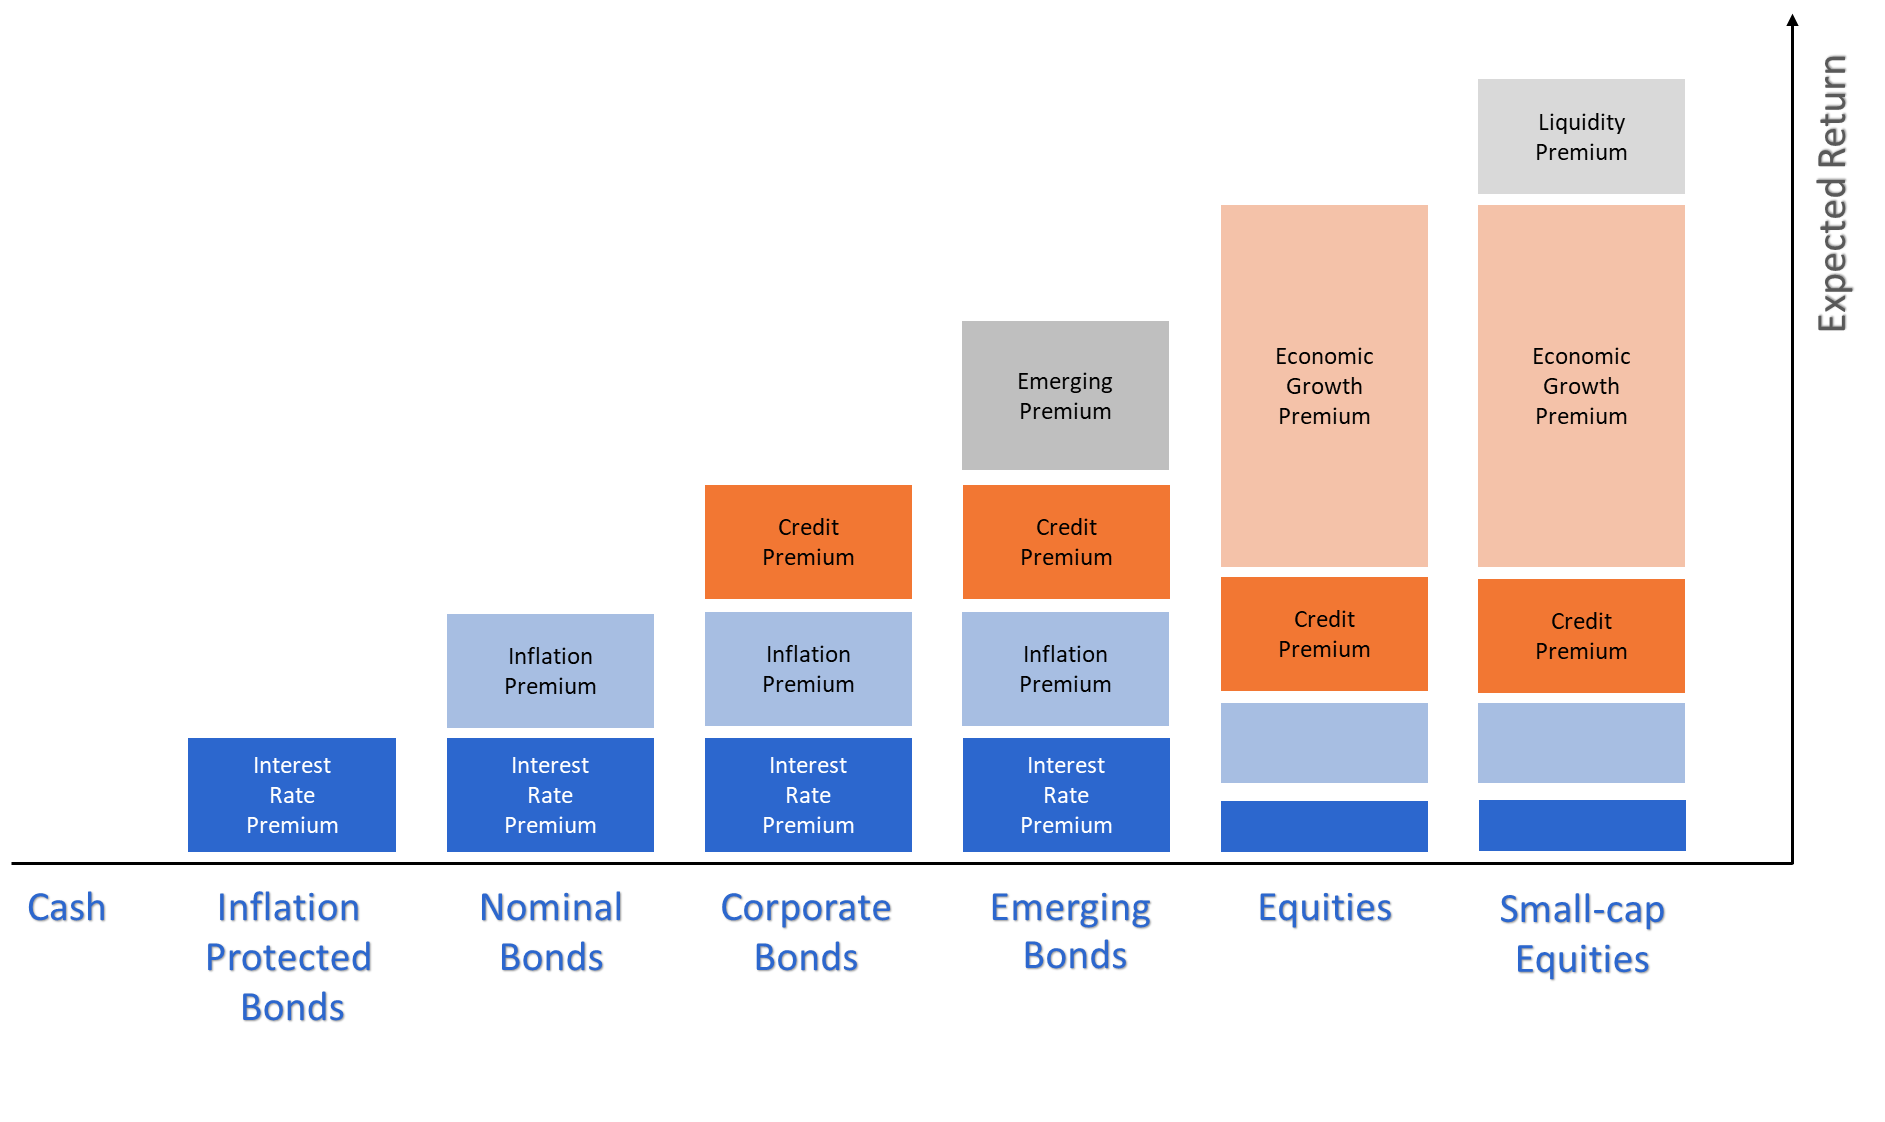
One solution to these macroeconomic risks is factor investing, commonly referred to as smart beta. Factor investing is about identifying and precisely targeting broad, persistent, and long recognized drivers of returns. With today’s advances in data and technology, factor investing has been taken to new levels, empowering investors to become more informed and seek a better balance of those return drivers in portfolios. Smart-beta diversifies a portfolio around these identified risk factors to diversify these risks, similar to how modern portfolio theory attempts to find the most efficient return for the stake that an investor is willing to take. Intelligent beta portfolios are considered a long-term passive strategy of rebalancing to long-term identified factor risks.
Figure 2: Factor Risk by Asset Class
Smart Alpha
(How We Approach Factor Investing)
We notice that in different economic environments, the financial characteristics of an asset class are essential determinants of its relative return performance. At various stages in the business cycle, these characteristics may help bonds, for example, and hurt stocks. The crux of our investment strategy is to understand how the financial aspects of an asset class are likely to interact with the economic backdrop. We call our approach smart alpha in homage to the studies that discovered these macroeconomic factors that smart beta attempts to address.
Our approach to factor investing consists of estimating the expected return premia based on the business cycle, then assessing the spot (current) risk premia based on existing macroeconomic factors and comparing the two.
Expectations
Estimating Expected Return requires accurate insight into the economic outlook and its probable market impact on different investments within the economic backdrop. We approach this by breaking the business cycle down into six identifiable stages based on common regularities in each stage. These regularities in the business cycle used to time the stages continue to be one of the most valuable sources of information about the economic outlook and potential asset performance. They are a powerful tool in measuring expectations. We take these regularities and run them through a machine learning algorithm based on fuzzy logic and decision tree A.I. that outputs the current stage of the business cycle from which we calculate historic risk premia by stage.
Think about it like this. If it is common knowledge that a recession is preceded by market loss, wouldn’t it be prudent to theorize that the macroeconomic environments carry different risk-premia? As such, wouldn’t factor-based diversification also be added during a recession compared to an expansion? While it might not be the only missing piece, including it in investment practice can rapidly change the risk-adjusted returns one can expect from a portfolio. This thesis can be taken further by understanding that not all business cycles are the same. While often similar, managing risk around macroeconomic factors that can shift between stages is an important concept to understand.
Figure 3: Risk Premia by Stage of the Business Cycle
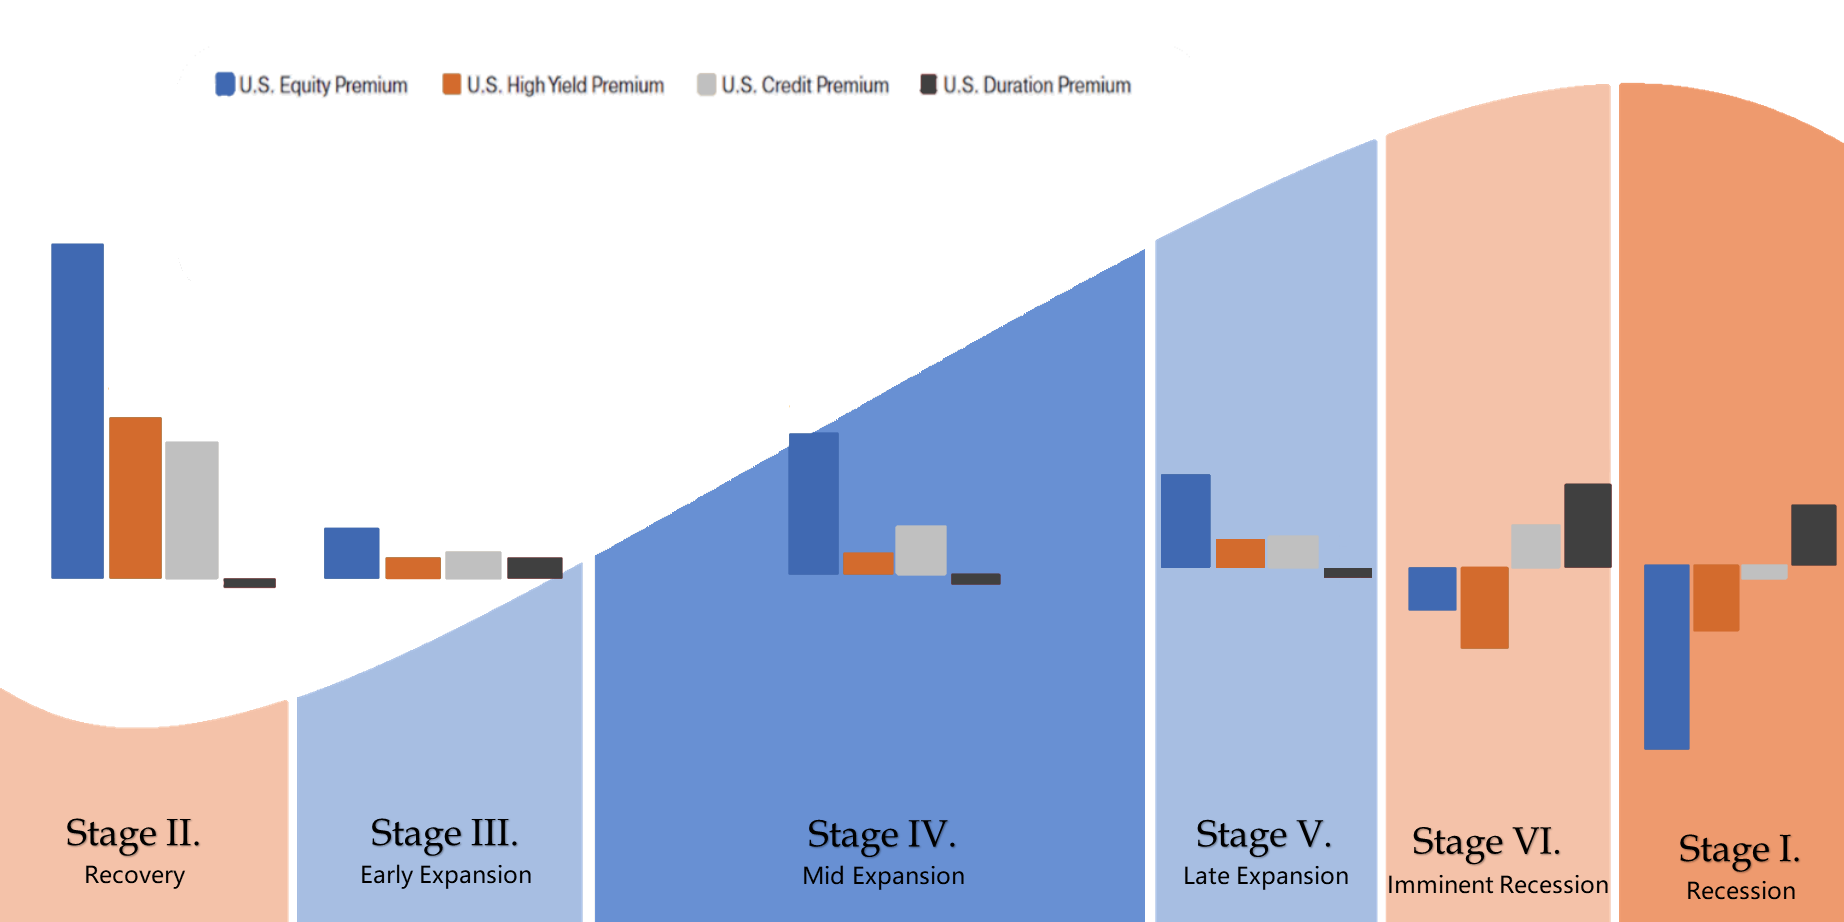
Figure 3 shows the different historic risk premia per our business cycle classification model. For example, the premium for equities is most significant during recovery and is least favorable during a recession.
Current Environment
Spot risk premia is not as complicated as it seems. It is, is the risk premia based on the current macro factor trends. For example, what is the historic risk premia when growth and credit risk decrease? It also depends on the asset in question. For example, international securities will require the use of the emerging sovereign factor and other elements to calculate the spot premia of global securities.
Our research, accumulated through the scrutiny of the interaction between macroeconomic factors and security returns over the last 50 years, provides overwhelming evidence that macroeconomic regimes show different risk-reward relationships. We use this information to tactically navigate the financial markets.
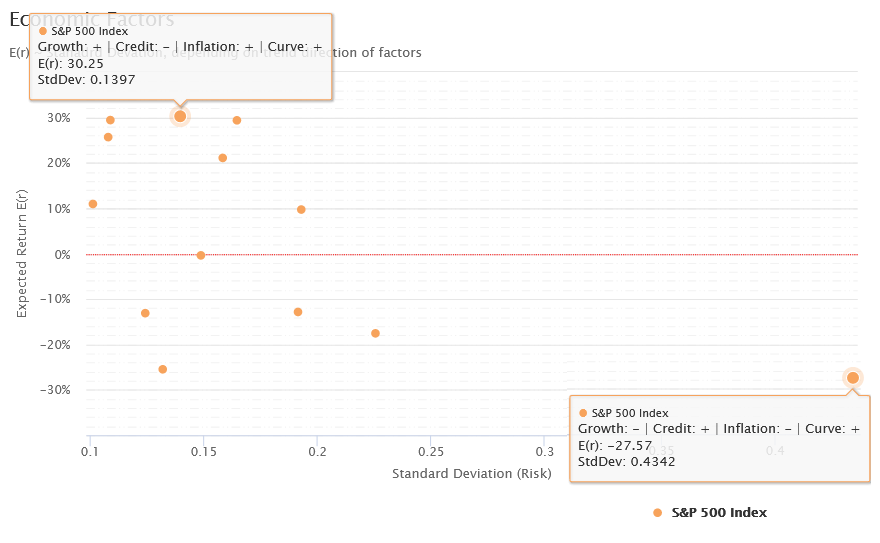
For example, figure 4 shows the expected return and standard deviation of the S&P 500 Index during different trends in macro factors. The S&P 500 Index seems to perform best when the growth is increasing, and credit risk is decreasing. The S&P 500 Index goes through increased volatility and negative expected return when the following trends are occuring: growth is trending down, credit is increasing, inflation is decreasing and the yield curve is steepening. By the way, the combination of trends in macroeconomic factors is consistent with what is expected in a recession.
Figure 4: Expected Return Vs Deviation
Combinations of Factors for the S&P 500 Index